
bantamCloud - Part 2 - Configure
Part two of this series will cover base configuration for your Pis. Before we get started there are some prerequisites;
Prerequisites
SD Preparation
You will need one SD card for each Pi, if you’re following this blog exactly, flash them with the Ubuntu Server 20.04.1 64bit for Raspberry Pi (Direct link to Ubuntu download site)
Pi Power
Hopefully, if you followed the previous post bantamCloud - Part 1 - Build you already have a power brick as part of your cluster. You’ll need 3 short USB-C cables to connect the Pis to the power brick, 15-30cm should be fine but they won’t be great for the aesthetic (I’m still working on a way to get some short, perfect length cables with right-angle connectors for a nice clean build).
Fan Power
Hopefully you bought a fan with a USB adapter such as the 5V Noctua ones suggested in my previous post. If not, you can make one like mine with a little soldering skill and a spare fan connector and USB plug; feel free to repurpose some old USB cable and fan connector if possible!
Networking
Although it is possible to use WiFi, I would recommend using ethernet for a cluster like this. Ideally you have enough ports free on your router/switch to plug them in, or failing that, a cheap Gigabit switch will work, and then you can connect a single network cable from that to your main router or switch.
If you do choose to use a small switch connected to your main router for this cluster, bear in mind that you’ll be limiting your maximum uplink to the speed of that single port, probably 1Gb. This might not be an issue in practice, and in certain cases won’t matter at all, but bear it in mind if you want to use perform any high bandwidth operations from multiple machines outside of the cluster.
Pi Preparation
- I will be using Ubuntu 20.04 aarch64 on my Raspberry Pis. You can use Raspbian and things should mostly be the same since they’re both Debian based distros, but there may be some differences, particularly related to configuration of the Pi.
- Start by adding a user for yourself and enabling SSH Keys by following my previous post: SSH 2-Factor’s First Factor
- (Optional) Set up 2-Factor authentication for SSH using: SSH 2-Factor on Linux (RPi)
- Update all packages to latest on all of the Raspberry Pis.
- (Optional) Purge snapd - It’s wasting resources and I always uninstall it on any Ubuntu machine because I just don’t like it;
snap list
(list of installed snaps is printed)
sudo snap remove --purge <package name from list above>
(once all snaps are removed)
sudo apt remove --purge snapd
- Remove
cloud-init, we don’t need it. It will have set up some things for us on first boot, such as networking and keys, but we’re done with it now:
sudo apt remove --purge cloud-init
Configure
Networking / Static IPs
It’s good practice for servers to have static IPs on your network, it means they don’t move around when they reconnect, changing IP, and becoming harf to find. Hopefully you’ve connected the Pis to your network by now, and they’ve all been assigned IPs. If possible, find a range of 3 addresses by looking at your router to see which IPs are already taken, and assign those in sequence, for a nice easy to remember IP range.
Don’t worry if your Pis already have addresses you don’t want to use; so long as you find a range of addresses which aren’t used by other devices in your network, we’ll statically assign them on each Pi.
Netplan
Ubuntu 20.04 uses Netplan to configure networking, if you’re using Raspbian this configuration won’t apply, and you’ll need to look up how to configure networking in /etc/network/interfaces.
Find the Netplan file, in my case it was created by cloud-init and it’s found at `/etc/netplan/50-cloud-init.yaml, mine looks like this;
network:
    version: 2
    ethernets:
        eth0:
            dhcp4: false
            addresses: [192.168.31.41/24]
            gateway4: 192.168.31.1
            nameservers:
                    addresses: [192.168.31.1]
In my case, my Pis are on a subnet of 192.168.31.41/24 and my “gateway” or router is 192.168.31.1 and I’m only using IPv4 networking, IPv6 is left not configured.
I’ve also set my name server to my router, this allows me to connect to the Pis from my other machines using their hostnames, e.g. ssh rpi4b-4gb-1 because the hostname of the first Pi is rpi4b-4gb-1, I’m jut so creative when it comes to naming machines!
Were you to set your name server to something external like 1.1.1.1, this wouldn’t work, because that name server doesn’t know the name of local devices on your network.
Disable Bluetooth and Wi-Fi, and reduce GPU memory
Since we’re not going to use Bluetooth or Wi-Fi, it’s a good idea to disable them, it’ll save some resources and may even help the Pi run a little cooler.
Because we’re on Ubuntu, raspi-config is not available, so we will need to edit the config files manually.
If you’re interested in making the following tweaks to a Pi running Raspbian, they should all work just the same, jut note the different file to place them in,
/boot/config.txton Raspbian.
GPU Memory
Reducing the GPU memory means that more RAM is available for the system to use, this is recommended when running as a server since we won’t be displaying anything or using the GPU.
First, edit /boot/firmware/config.txt and add gpu_mem=16 under the [all] section:
NOTE: This file recommends not editing it but instead editing
usercfg.txt, however, I’ve been unable to make this value take effect by setting it anywhere other than here.
It should now look something like this;
[all]
gpu_mem=16
arm_64bit=1
device_tree_address=0x03000000
Reboot your Pi, and if you installed vcgencmd by following my post on building it for Ubuntu on the Pi, you can check the split;
vcgencmd get_mem gpu
gpu=16M
NOTE: There are also settings for CMA allocation of memory “dynamically” for the GPU, but I haven’t investigated these yet.
Wi-Fi and Bluetooth
We can use the handy dt-overlay feature to disable these and save a few resources;
Edit /boot/firmware/usercfg.txt and add the following lines:
dtoverlay=disable-bt
dtoverlay=disable-wifi
Reboot to apply the changes, then run iw list, if nothing at all is output, you’ve successfully disabled Wi-Fi. To test if bluetooth is disabled you can use bluetoothctl list if it’s installed. If it is, uninstall it once you’ve checked Bluetooth is disabled, sudo apt remove bluetooth, we won’t be needing it any more.
Disable LEDs (Optional)
This one is a little extreme, but I didn’t want any light emitted since my Pis were originally in a case where I couldn’t see the LEDs, so disabling them seemed like a nice idea, here is the configuration if you want to do the same.
This will disable both the activity and the power LEDs after boot, the Pi will appear as if it is off;
In the /boot/firmware/usercfg.txt add 5 new lines;
dtoverlay=act-led
dtparam=act_led_trigger=none
dtparam=act_led_activelow=off
dtparam=pwr_led_trigger=none
dtparam=pwr_led_activelow=off
Reboot to apply the changes
Other Tools / Setup (Optional)
htop
htop is a very nice way to monitor the resources on your system, I tend to install it as one of the very first things on any new system, server or otherwise, it’s a great way to see CPU and memory usage at a glance, but also allows you to check on more advanced information about running services in a nicer format than the traditional top package.
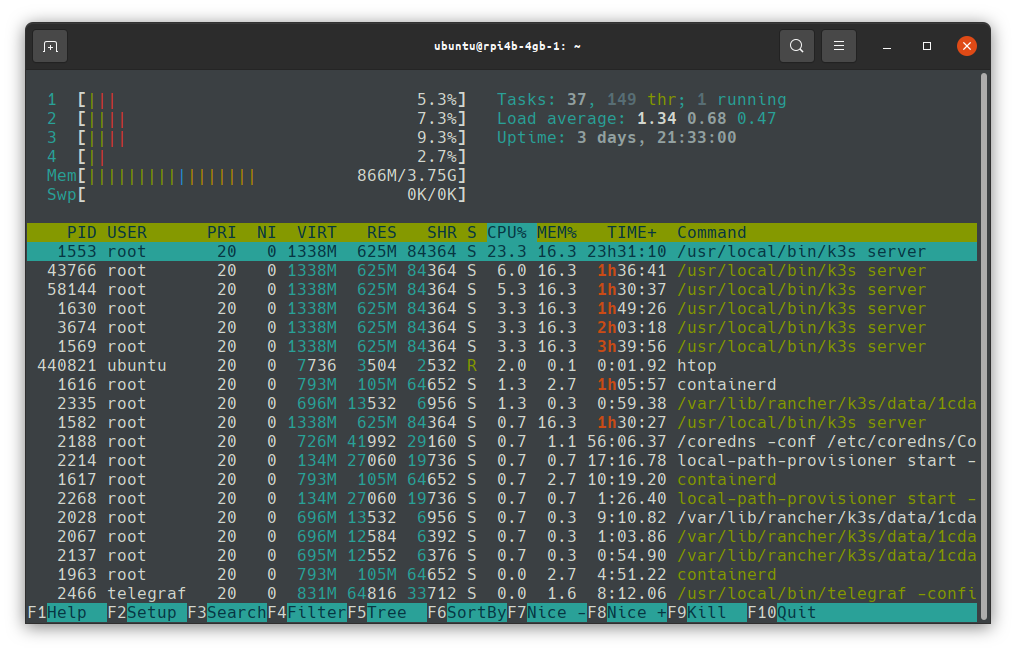
This Pi is busy running as a Kubernetes (using K3s) Control Plane (Kubernetes “Server” Node). It currently has no workloads, so you can see that even K3s is fairly heavyweight on a Pi4B 4GB.
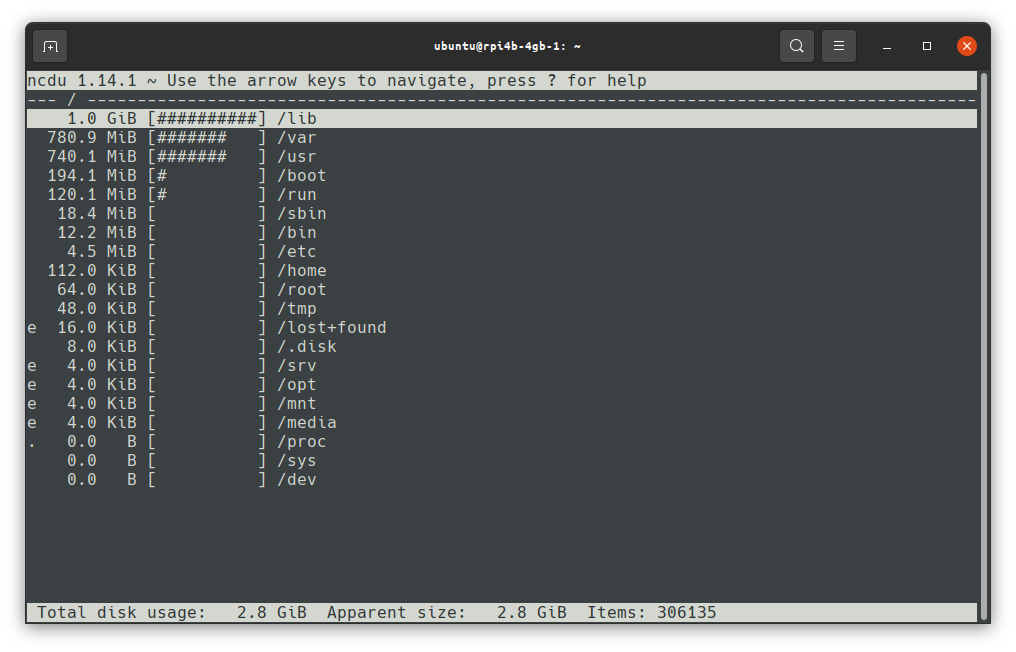
ncdu - NCurses Disk Usage
ncdu is another tool handy tool I really enjoy using, it helps visualise where space is being used up most on a system, and to clean it up with simple key presses. Be sure to run it as root (sudo) if you want to read directories outside of home;
sudo ncdu /:
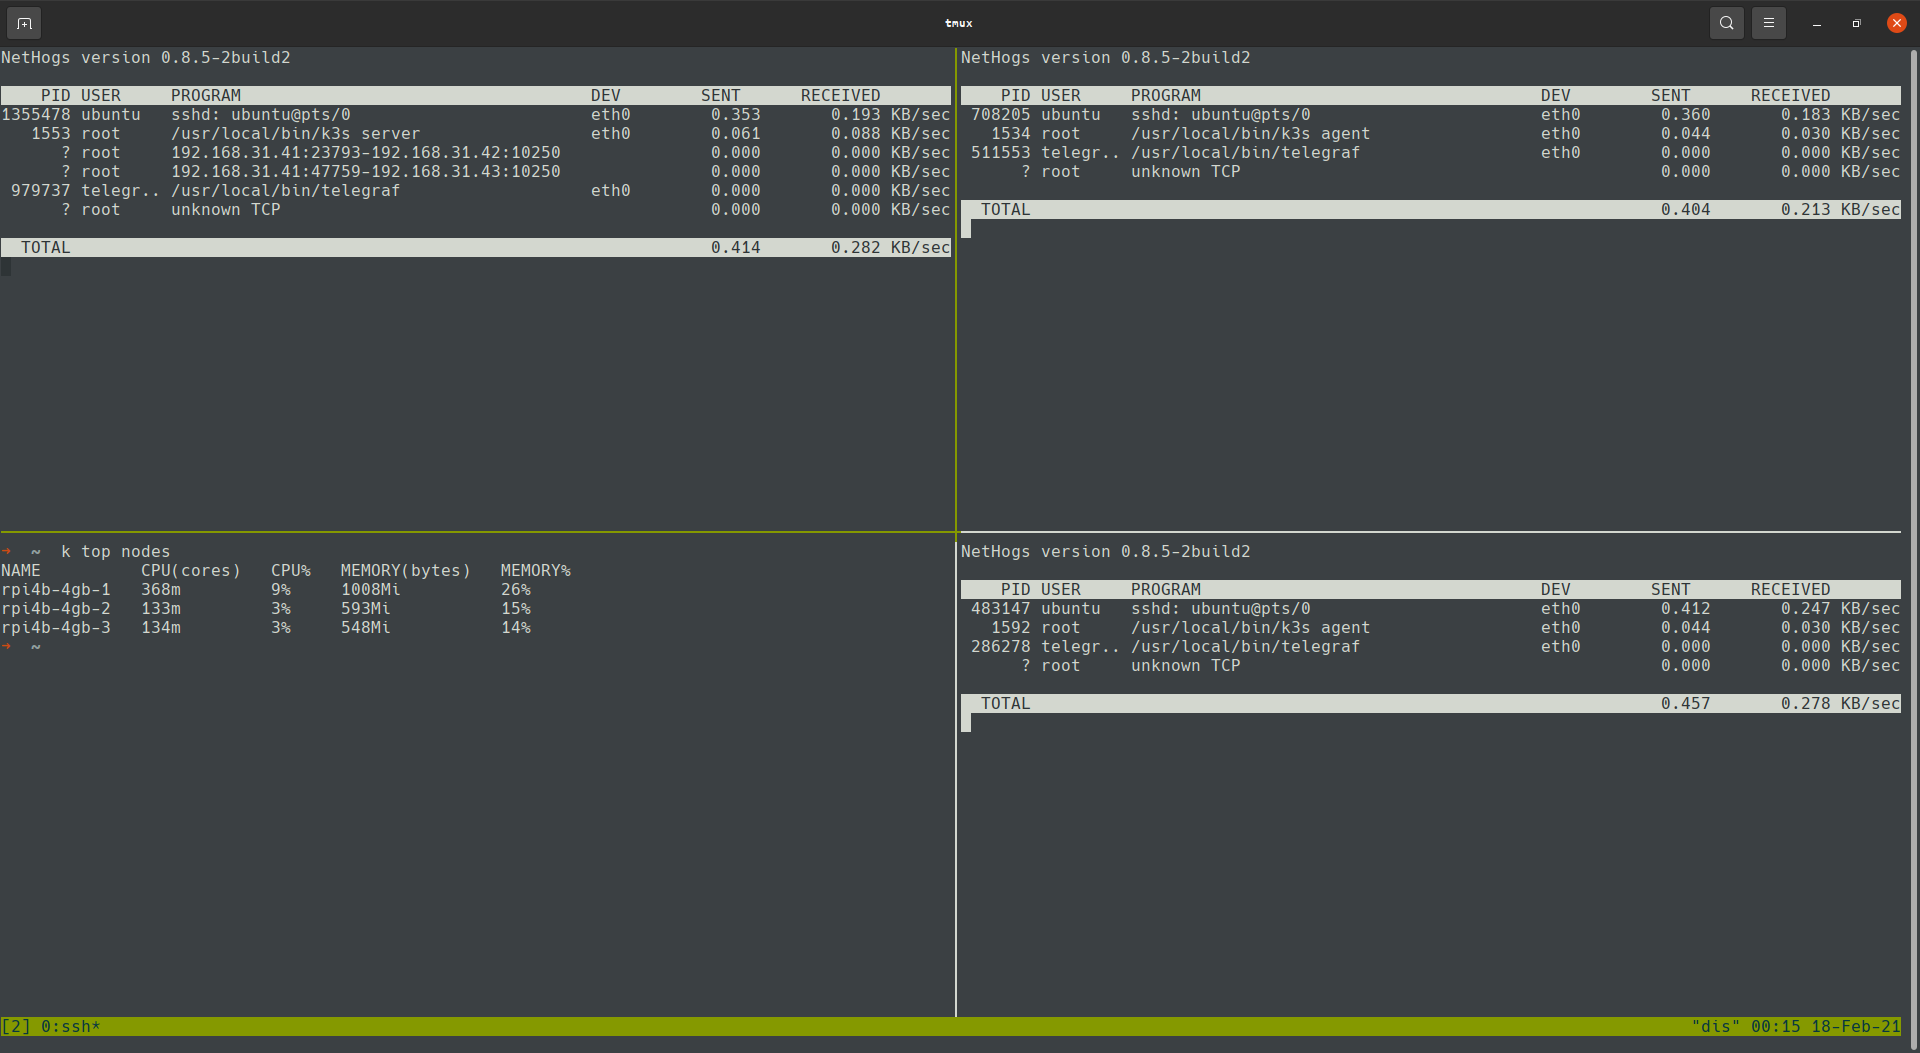
nethogs
Nethogs is another command line tool which will show you the networking going on on your machine, it’s great for seeing at a glance which processes are causing traffic. Limit it to a physical network adapters to get the external networking:
sudo nethogs eth0
Log to RAM
If you’re using micro SD cards for your Pi OS like I am, it is a good idea to move your logs to RAM. By moving your logs to RAM, you reduce write wear on the micro SD cards and reduce the time to failure.
Follow the instructions at azlux/Github to install and configure log2Ram, which is a set of scripts which will manage the hard work for you.
I’ve customised a couple of settings to my preference in /etc/log2ram.conf;
- SIZE=30M
- USE_RSYNC=true
- Be sure to install rsync with
sudo apt install rsync
- Be sure to install rsync with
- MAIL=false
I’ve also disabled the daily write to disk, as I’m generally not interested in persisting logs (It’ll still write on shutdown/reboot);
sudo systemctl disable log2ram-daily.timer
You should now start the log2ram service, but it may not yet start if your /var/log directory is too large. Go through the steps below to clean up and limit the journal log size then come back to start log2ram;
sudo systemctl start log2ram
NOTE: If you set the size to 30M like I have, you may not be able to start log2ram yet. Once the journal logs are cleaned up below, you’ll have more luck.
Limit systemd journal logs
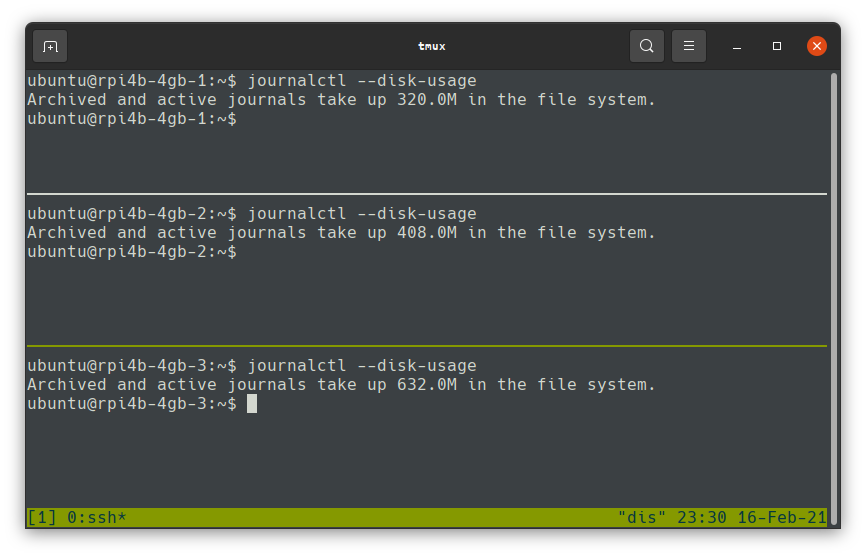
Systemd logs provide a plethora of information on services and their status for systems which use it, but by default it can store and retain huge numbers of logs, we should clean up what’s there and limit the maximum size, and there will be less for log2ram to handle.
Clean up existing logs. First rotate the existing logs to archive them; the following commands will only clean up archived logs, not active ones:
sudo journalctl --rotate
Next, “vacuum” the logs to clear anything older than a certain period. I like 7 days, but set this as required. This performs an immediate cleanup but doesn’t yet set a limit:
sudo journalctl --vacuum-time=7d
Next, clean up by size too, I tend to keep this low too because I’m not too interested in logs from when I’m not around, I’m usually looking at them when I’m actively breaking things, again change this to a value you’re happy with:
sudo journalctl --vacuum-size=10M
Next, edit the journal config /etc/systemd/journald.conf
and set the SystemMaxUse to less than the log2ram value, be sure to uncomment it by removing the # at the start.
SystemMaxUse=20M
Finally, restart journald for the change to take effect:
sudo systemctl restart systemd-journald
For further information on journalctl and how to use it, check out the Ubuntu man(ual) page
Troubleshooting log2ram startup
If log2ram fails to start, here’s some tips for troubleshooting;
- You can check why using
sudo journalctl -u log2ram; if the issue isERROR: RAM disk for "/var/hdd.log/" too small. Can't sync., you either need to clean more logs or increase the log2ram size. - Using
ncduyou can check your current log size;sudo ncdu /var, look for the size of thelogdirectory. If it’s too large, you can:- Rotate and clean up more logs by specifying a smaller number, e.g.
10K - Clean up some files manually, bearing in mind that some services might fail to log if the file is missing (a quick reboot should hopefully solve this)
- Increase the log2ram size to a value you’re happy with and is bigger than the current size of
/var/log.
- Rotate and clean up more logs by specifying a smaller number, e.g.
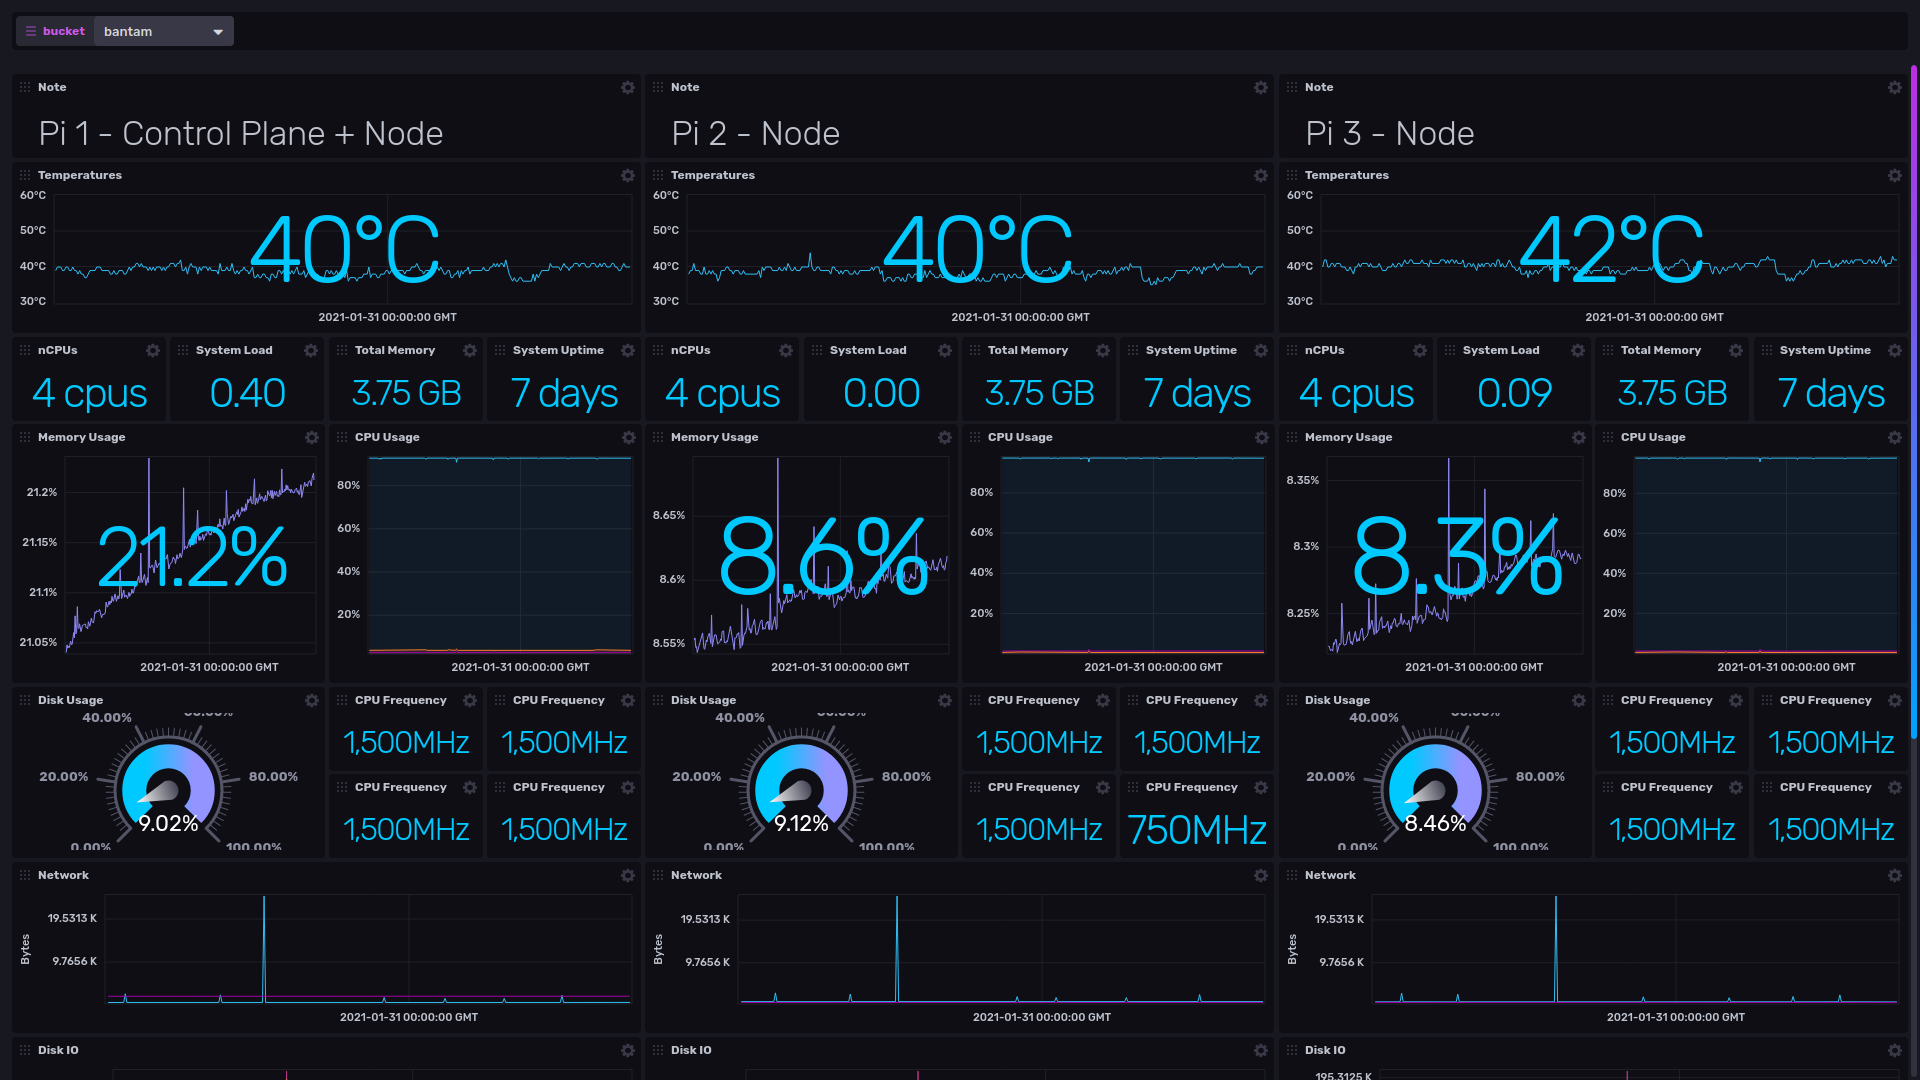
InfluxDB/Telegraf

If like myself, you’d like to keep an eye on what your Pis are up to, InfluxDB is a great way to show all of your stats in a Dashboard. InfluxDB 2.x includes the dashboard built in, previously you would have to run Chronograf or Grafana.
With InfluxDB 2.x a separate dashboard tool is no longer necessary, but I do find the learning curve steep for the “flux” language, and generally the built in dash is less intuitive to configure than Chronograf or Grafana.
First of all, setup InfluxDB 2.x. You should run it on a machine which is always on, because it needs to collect your metrics. You could also run it on one of the Pis in your cluster but I prefer not to do this as it uses up resources we want for other tasks.
For a quick setup, you can run Influx in Docker, once you have a suitable machine to run it on, with Docker installed, start InfluxDB;
NOTE: This is an insecure setup for testing only, it does not mount a volume to keep your data if the container is stopped, it also does not provide HTTPS.
docker run -d -p 8086:8086 --name influxdb quay.io/influxdb/influxdb:v2.0.4 --reporting-disabled
The
--reporting-disabledflag tells influxdb to disable the phone-home reporting it does by default, and is “opt-out”. You can choose whether or not to supply this flag, but I personally am strongly opposed to opt-out phone-home features and aim to disable them as a matter of course wherever possible.
Once you have started InfluxDB, you can browse to it using http://<ip of machine with influx>:8086.
Board Variables
I have configured the Dashboard to use three variables so that you only need to change the hostnames of your Pis in one place. Create 3 variables in the Settings menu called pi1, pi2 and pi3. The variables should be query type with the following query;
from (bucket: v.bucket)
  |> range(start: v.timeRangeStart)
  |> keep(columns: ["host"])
  |> distinct(column: "host")
  |> filter(fn: (r) => r["host"] == "<pi hostname>")
  |> keep(columns: ["_value"])
For each variable set the <pi hostname> to the value of each of your Pis as they’ll be reported by Telegraf.
Note: You could modify the dashboard to only show one Pi per screen, by removing two thirds of the cells and edit a single variable removing the host specific filter in order to allow any number of Pis to be displayed by switching between them with the variable. This would be more scalable for larger clusters.
Install Telegraf
Telegraf is a “collector” component. It is a small binary, which runs as a service on the machine you want to collect data about, it also comes from InfluxData, and when configured through its configuration file, collects system and other data and sends it to InfluxDB for storage and graphing.
Start by downloading the ARM binary for Telegraf to each of your Pis, visit the Influx download page (here) for the current version, be sure to select “Linux Binaries (ARM)”)!
Influx has Documentation here on installing using their apt repository for Ubuntu, I haven’t tested these as I installed the binary and systemd unit file it comes with manually, but this method should be easier and allow your Telegraf to update with apt rather than manually like mine;
Here’s my telegraf.conf to deploy to each Pi, be sure to set your token, organisation, bucket and Influx IP/hostname as you’ve configured them in the web UI: telegraf.conf
That’s it for Part 2.
Hopefully setup went well, and you’re collecting metrics in your dashboard, your Pis are rotating their logs in RAM and you have some command line tools to keep an eye on the Pis manually.
That’s it for bantamCloud - Part 2 - Configure. I hope some of the tools and techniques here have been useful. In Part 3 I’m going to cover setting the cluster up for Kubernetes with K3s and cover some of the many caveats to running Kubernetes on a cluster of Raspberry Pis.